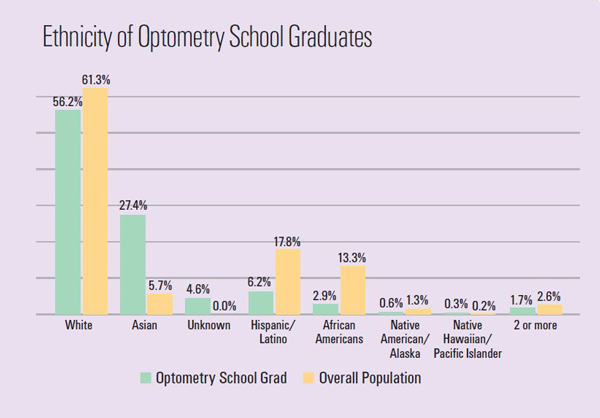
There is increasing diversity among optometry school graduating classes – not just based on gender. This chart shows the percentage of graduates by ethnicity, compared to the census bureau numbers showing population by demographic.


Sources are the 2016-17 ASCO Student Data Report and the 2017 U.S. Census Bureau data.


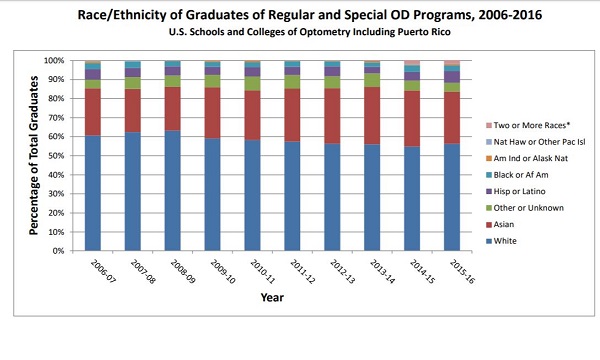
This chart comes from the ASCO Student Data Report 2016-17 that shows the change in ethnicity of optometry school grads in the U.S. and Puerto Rico over a 10-year span.


